Investigation
Sullivan County Has 445 EFA-Eligible Students. We Still Cannot See What the Money Changes.
New data show where EFA money is being spent, but not whether it creates a new educational opportunity or replaces an expense a family was already paying.
Key finding
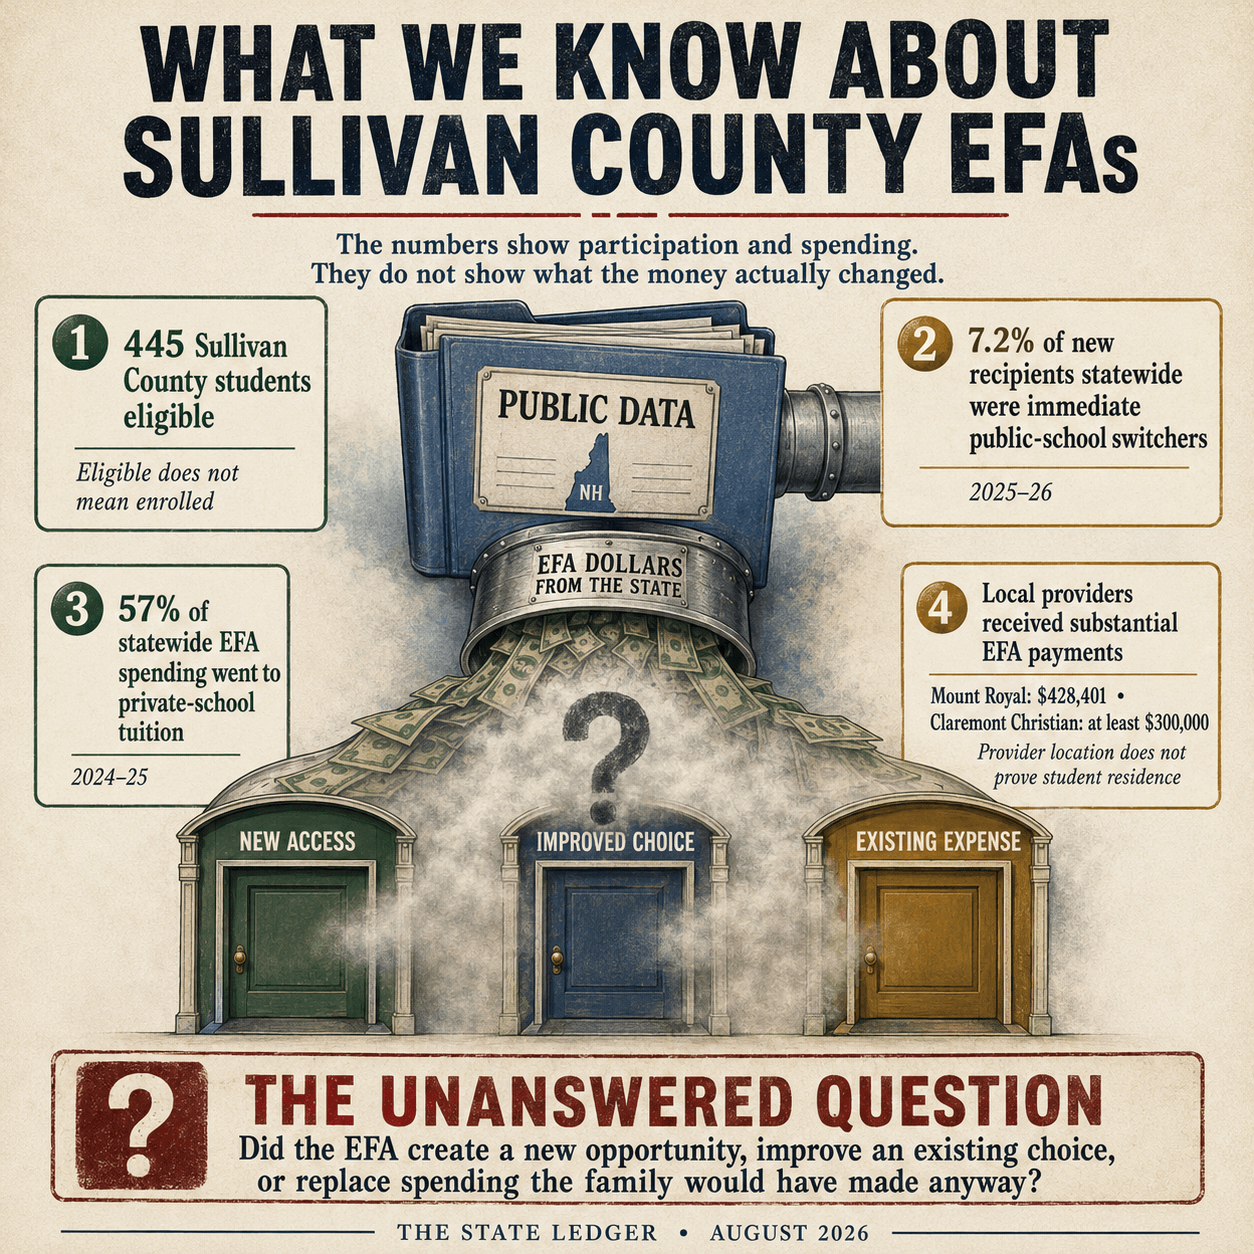
New Hampshire knows how many students receive Education Freedom Accounts. It does not publicly show how often those accounts create a new educational opportunity, improve a choice the family had already made, or simply transfer an existing private expense to taxpayers.
 (opens the full-size image in a new tab)
New Hampshire has made one part of its Education Freedom Account program easier to see.
On August 19, the Children’s Scholarship Fund New Hampshire launched a public dashboard showing EFA participation by municipality. As of August 26, it listed 445 eligible students across Sullivan County, including 133 in Claremont, 75 in Newport, 40 in Sunapee and 35 in Charlestown.
That is not a trivial number. Sullivan County has approximately 5,600 residents between ages 5 and 17, based on the Census Bureau’s 2025 population estimate and age distribution. The comparison is necessarily approximate because EFA eligibility extends beyond that age range and the dashboard includes eligible students who may be waitlisted. Still, the 445 students are equivalent to roughly 8 percent of the county’s school-age population.
That is meaningful new information. It is also where the public trail largely ends.
The dashboard does not show how many of those 445 students are actually enrolled rather than waiting for a place. It does not connect their towns of residence to the schools and vendors they use, show where they were educated previously, or publish educational results that can be evaluated at the county level.
Most importantly, it does not answer the question that determines what taxpayers are purchasing:
What educational decision did the EFA actually change?
What the statewide numbers suggest
The best available statewide evidence indicates that relatively few new EFA recipients came directly from public schools.
According to November 2025 Department of Education figures reported by the New Hampshire Bulletin, the program had 10,510 recipients for the 2025–26 school year. Of the 4,745 new recipients, 343 had attended public school the preceding year.
That is 7.2 percent of new recipients and 3.3 percent of all recipients.
The denominator matters. It would be misleading to say that only 3.3 percent of new students switched from public schools. The correct figure for new recipients is 7.2 percent. But either calculation points to the same broader fact: most recipients were not direct public-school switchers when they entered the program.
That figure measures immediate prior enrollment, not causation. It does not prove that the other 92.8 percent would have made exactly the same educational choices without an EFA. Some were entering kindergarten. Some may have left public school more than a year earlier. Others may have been homeschooling because private school was unaffordable, struggling to maintain a private placement, or looking for tutoring, therapy or specialized instruction.
Still, the numbers do not support treating every EFA recipient as a student newly liberated from a public school that was not working. For most new recipients, the program entered a situation in which the student was already outside the public system immediately before receiving an EFA.
Where the money is actually going
Public expenditure reports provide a clearer picture of what EFA families purchase statewide. In 2024–25, families spent $20.2 million in EFA funds. Approximately $11.5 million, or 57 percent, went to private-school tuition. Instructional materials accounted for 23 percent, and summer or specialized programs accounted for another 9 percent, according to an analysis of the Children’s Scholarship Fund data by the Concord Monitor.
Those are the latest complete expenditure figures publicly available, but they predate universal eligibility. Families still had to meet the income limit during 2024–25, so the figures provide a baseline rather than a description of the newly expanded program.
Two of the larger tuition recipients were located inside Sullivan County.
Mount Royal Academy in Sunapee received $428,401 in EFA tuition payments in 2024–25. Claremont Christian Academy received at least $300,000. The current Claremont Christian tuition schedule ranges from $7,300 to $7,900 for grades K–12. Published estimates place Mount Royal tuition at approximately $10,700 for its highest grade.
Those payments went to schools located in Sullivan County. They should not be mistaken for spending exclusively on Sullivan County residents because both schools may enroll students from other counties.
At those prices, an average 2024–25 EFA of $5,204 could cover roughly two-thirds of tuition at Claremont Christian and about half at Mount Royal. For some families, particularly those also receiving school-based aid, that could plausibly change whether private school is affordable.
The same calculation produces a very different result at the region’s elite preparatory schools. Kimball Union Academy charges $52,500 for day students and $83,300 for boarding students in 2026–27. Cardigan Mountain School, just across the county line in Canaan, charges $48,900 for day students and $84,400 for domestic boarding students.
Historical reports confirm that EFA money has been used at KUA and Cardigan, although prep schools accounted for only 2 percent of statewide EFA tuition spending in 2024–25. That is important context: expensive preparatory schools are permitted uses, but they are not where most EFA tuition dollars go.
An EFA worth approximately $5,000 cannot, by itself, make tuition of $50,000 to $84,000 affordable to a household earning $50,000. For the EFA to create access at one of these schools, substantial institutional financial aid or some other resource must close most of the gap.
That can happen. Both schools offer need-based financial aid. Kimball Union says it considers income, assets, expenses and debt when determining a family’s contribution. Cardigan reports awarding more than $3 million in financial aid to more than 30 percent of its students in 2025–26.
But that creates another unanswered question: does the EFA supplement institutional aid, reduce the family’s expected contribution, or replace aid the school otherwise would have provided?
Those arrangements represent very different public outcomes.
If a school provides $45,000 in aid and an EFA reduces the family’s remaining payment from $7,500 to $2,500, the state grant may genuinely open a door.
If the family was already prepared to pay $47,500 and the EFA reduces its bill to $42,500, the public money subsidizes a choice already within reach.
If the school reduces its own aid after the family receives an EFA, the public payment may benefit the institution more than the family.
The public reporting does not distinguish among these possibilities.
The same grant can produce different outcomes
A roughly $5,000 account can cover a large share of tuition at a lower-cost religious school. It may pay for most of a homeschool curriculum, tutoring, specialized therapy, technology or several online courses. In those settings, the grant may substantially change what a family can provide even when it does not change the student’s formal educational category.
The Children’s Scholarship Fund’s own impact report offers an instructive example. One family said it would have homeschooled without an EFA, but the account allowed it to purchase curriculum, tutoring, STEM materials and other activities. That EFA did not create the decision to homeschool. It did change the education delivered within that decision.
That is a real benefit, but it is different from moving a student out of public school, and it should be measured differently.
The program therefore appears to serve at least three distinct purposes:
- Choice creation: The EFA makes an educational option possible that the family could not otherwise afford.
- Choice improvement: The family would make the same broad choice without the EFA, but the funding improves or sustains the education provided.
- Expense substitution: The family would purchase substantially the same education without the EFA, and public money now covers part of the existing expense.
All three are currently counted as participation. New Hampshire does not publicly report how much of the program falls into each category.
What we know in Sullivan County
The new dashboard lists the following eligible students by municipality:
| Municipality | Eligible students |
|---|---|
| Claremont | 133 |
| Newport | 75 |
| Sunapee | 40 |
| Charlestown | 35 |
| Cornish | 23 |
| Plainfield | 22 |
| Grantham | 21 |
| Croydon | 19 |
| Lempster | 18 |
| Goshen | 17 |
| Springfield | 16 |
| Washington | 11 |
| Langdon | 8 |
| Unity | 5 |
| Acworth | 2 |
| Sullivan County | 445 |
The dashboard also supplies a broad income indicator. In Claremont, for example, 103 of 133 eligible students, or 77.4 percent, qualified under the income threshold used for statutory priority. Fourteen were identified as students with special needs, and 13 were waitlisted when the data were reviewed.
That cuts against the simplest claim that EFAs now primarily serve wealthy families. Statewide, more than three-quarters of eligible students were reported as qualifying under the income threshold even after universal eligibility took effect.
But the threshold is broad. In 2026, 350 percent of the federal poverty guideline equals $75,740 for a two-person household, $95,620 for three people and $115,500 for a family of four. The dashboard groups families near the poverty line together with families earning more than $100,000, depending on household size.
A binary measure therefore does not tell taxpayers how many participating families are poor, how many are middle income, or how close they are to the cutoff. Household income also does not reveal assets, institutional financial aid or how a family pays the remaining tuition.
Nor can the municipal dashboard be connected to the expenditure reports. Provider reports can identify statewide payments and, for providers serving at least 10 students, participation counts. They do not connect those students to their municipalities. We can see 445 eligible students living in Sullivan County and substantial EFA payments to schools located here, but we cannot determine how many of those payments were made for Sullivan County residents or where the county’s students spent the rest of their accounts.
A subsidy, but for what?
Every EFA is, in the ordinary fiscal sense, a public subsidy. The state transfers public education money into an account controlled by a family for approved educational expenses.
Calling the program a subsidy therefore does not resolve the policy question. The important distinction is what the subsidy accomplishes.
Does it give a low-income student access to an education that was otherwise impossible? Does it improve a homeschool program a family had already chosen? Does it help a middle-income family maintain a private placement? Or does it reimburse a household for tuition it was already able and willing to pay?
The available evidence suggests all of those situations may exist. The state counts them together and publishes too little information to measure their relative size.
That is especially significant after universal eligibility. When the program was income-limited, the state could at least argue that financial need was built into eligibility. Now income primarily determines priority when enrollment is constrained. The public needs better information, not less, to determine whether expansion is producing new access or merely expanding the number of existing expenses eligible for public reimbursement.
What taxpayers should be able to see
EFA families already must provide an annual record of educational attainment through a standardized test, the statewide assessment or an evaluated portfolio. The accountability gap is not that families submit nothing. It is that the state has not historically compiled and published those different records in a form that allows taxpayers to evaluate program-wide or county-level results. Legislation introduced in 2026 sought to require more consistent reporting and analysis.
No student names, addresses or personal records are needed to improve the public reporting. Aggregated data could show, by county or sufficiently large municipality:
- Students’ prior educational settings
- Current education type and provider category
- Household-income bands
- Grant and expenditure amounts
- Use of institutional financial aid
- Students entering, leaving and returning to public schools
- Educational-attainment methods and aggregate results
Those are the records needed to determine what Sullivan County’s EFA spending actually changes.
Until those answers are available, the most defensible conclusion is also the most revealing one:
New Hampshire knows how many students receive Education Freedom Accounts. It does not publicly show how often those accounts create a new educational opportunity, improve a choice the family had already made, or simply transfer an existing private expense to taxpayers.
Sullivan County’s 445 eligible students are not evidence that the program succeeds or fails. They are evidence that the program is now large enough locally that taxpayers deserve to know what their investment actually changes.
What the evidence shows
- 445 students across Sullivan County were listed as EFA-eligible on the Children's Scholarship Fund dashboard as of August 26, 2026, including 133 in Claremont, 75 in Newport, 40 in Sunapee and 35 in Charlestown.[1]
- Of 4,745 new EFA recipients statewide for 2025-26, 343 had attended public school the preceding year — 7.2 percent of new recipients and 3.3 percent of all 10,510 recipients.[3]
- Families spent $20.2 million in EFA funds in 2024-25. About $11.5 million, or 57 percent, went to private-school tuition.
- Two larger tuition recipients sit inside Sullivan County: Mount Royal Academy in Sunapee received $428,401 in 2024-25, and Claremont Christian Academy received at least $300,000.
What it does not show
- Eligible is not enrolled. The dashboard does not separate students actually receiving funds from those waitlisted.
- Prior enrolment is not causation. The 7.2 percent figure measures the year immediately before an account was opened; it does not establish what the other 92.8 percent would have done without one.
- Provider location is not student residence. Both Sullivan County schools may enrol students from other counties, so their payments cannot be attributed to county residents.
- The municipal dashboard cannot be joined to the expenditure reports. There is no public way to connect a town's students to the money spent on them.
- The income indicator is binary and the threshold is broad. It groups families near the poverty line with families earning more than $100,000.
← All articles & analysis · More on Education Freedom Accounts