Explainer
Your House Got Richer. Did You?
Property wealth helps a town raise money. It does not help a resident pay the bill.
Key finding
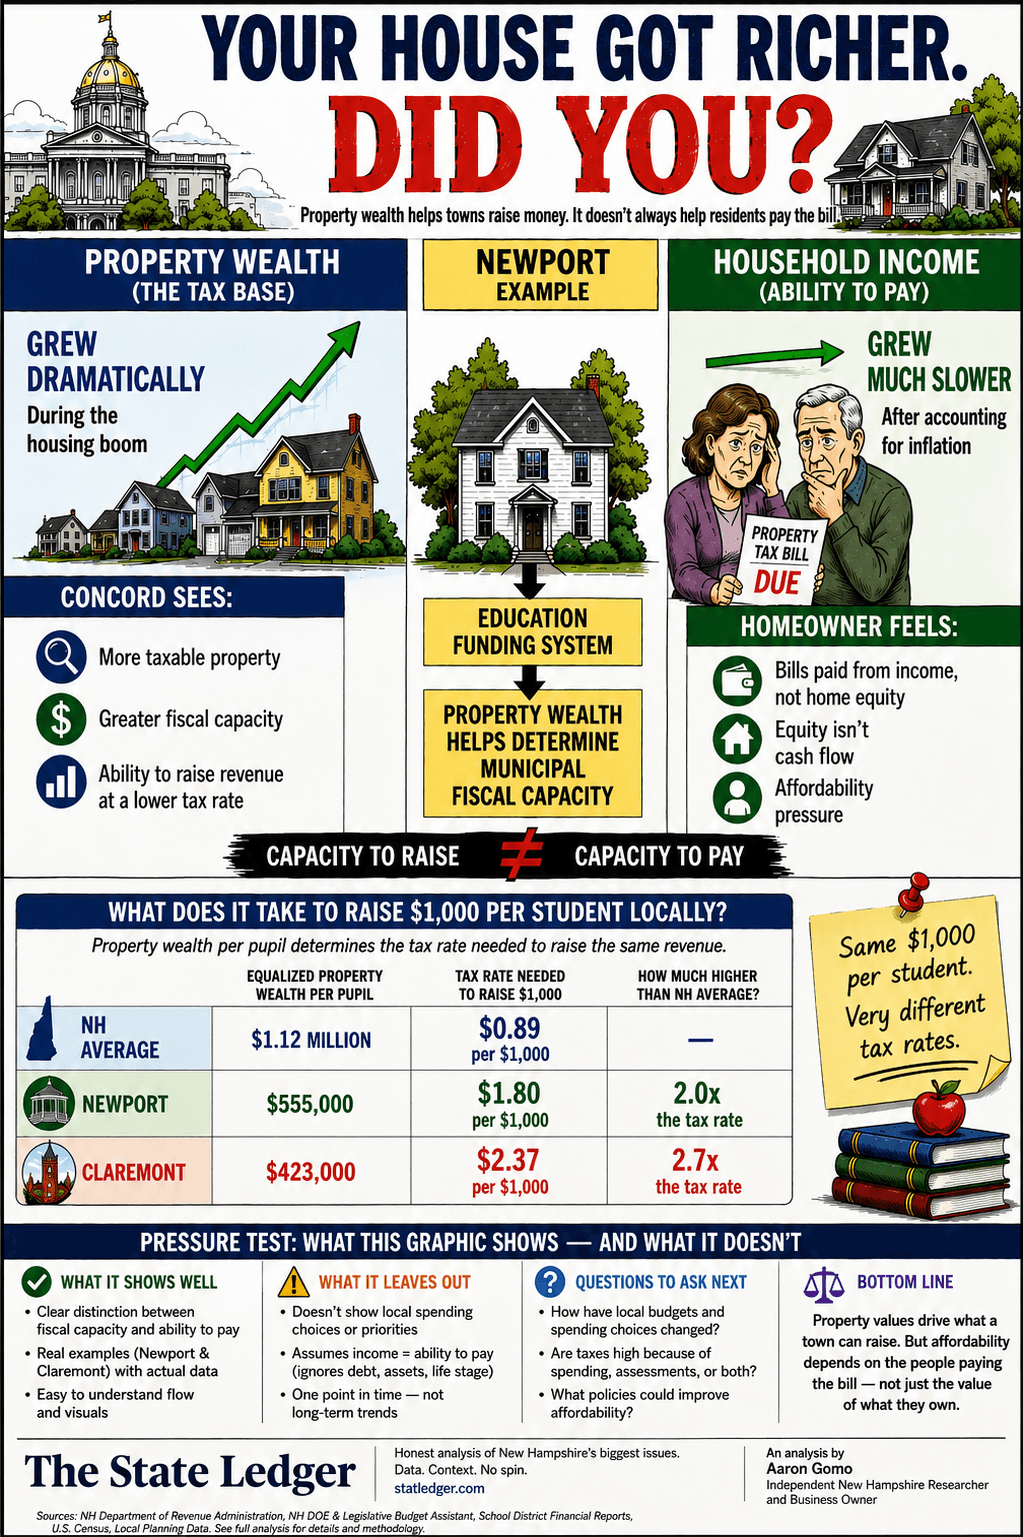
Capacity to raise revenue is not the same thing as capacity to pay the resulting bill. Property values determine what a town can raise; affordability depends on the income of the people who receive the bill.
 (opens the full-size image in a new tab)
The distinction the tax rate hides
A New Hampshire town sets its tax rate by dividing the money it has decided to raise by the total assessed value it can tax. Both halves of that fraction matter, and only one of them is a decision.
When Concord looks at a town with rising property values it sees more taxable property, greater fiscal capacity, and the ability to raise a given amount of revenue at a lower rate. That reading is correct as arithmetic.
What a homeowner experiences is different. Bills are paid out of income, not out of equity. Equity is not cash flow. A household whose home appreciated has not received anything it can spend, and if its assessment rose faster than the town average it now carries a larger share of the same levy.
What it takes to raise $1,000 per student
The table in this graphic holds the money constant and lets the tax base vary.
Against the state average of $1.12 million in equalized property wealth per pupil, raising $1,000 per student costs $0.89 per $1,000 of assessed value. Newport, with $555,000 behind each pupil, needs $1.80 — twice the rate. Claremont, with $423,000, needs $2.37, or 2.7 times the state average.
None of those three figures is a statement about how much a district spends. They are what it costs to raise the same dollar in three different places.
Why this framing matters
Arguments about New Hampshire property taxes usually take place on the spending side of the fraction, because that is the side a voter can act on at town meeting. The denominator is doing at least as much work, and no local vote changes it.
That does not make local budgets irrelevant. It means a comparison between two towns’ tax rates says very little about either town’s decisions until the tax base is accounted for.
What the evidence shows
- Equalized property wealth per pupil differs sharply between communities: $1.12 million for the New Hampshire average, $555,000 in Newport and $423,000 in Claremont.
- Raising the same $1,000 per student therefore requires $0.89 per $1,000 of value at the state average, $1.80 in Newport and $2.37 in Claremont — two times and 2.7 times the average rate.
- A clear distinction between fiscal capacity, which is a property measure, and ability to pay, which is a household income measure.
What it does not show
- It does not show local spending choices or priorities. Two towns in this comparison may budget very differently.
- It treats income as a proxy for ability to pay, which ignores debt, assets and life stage.
- It is one point in time, not a trend. It does not show how these figures have moved.
- It does not establish that any particular household's bill rose, or why.