Model
Why Spending Alone Doesn't Explain School Taxes
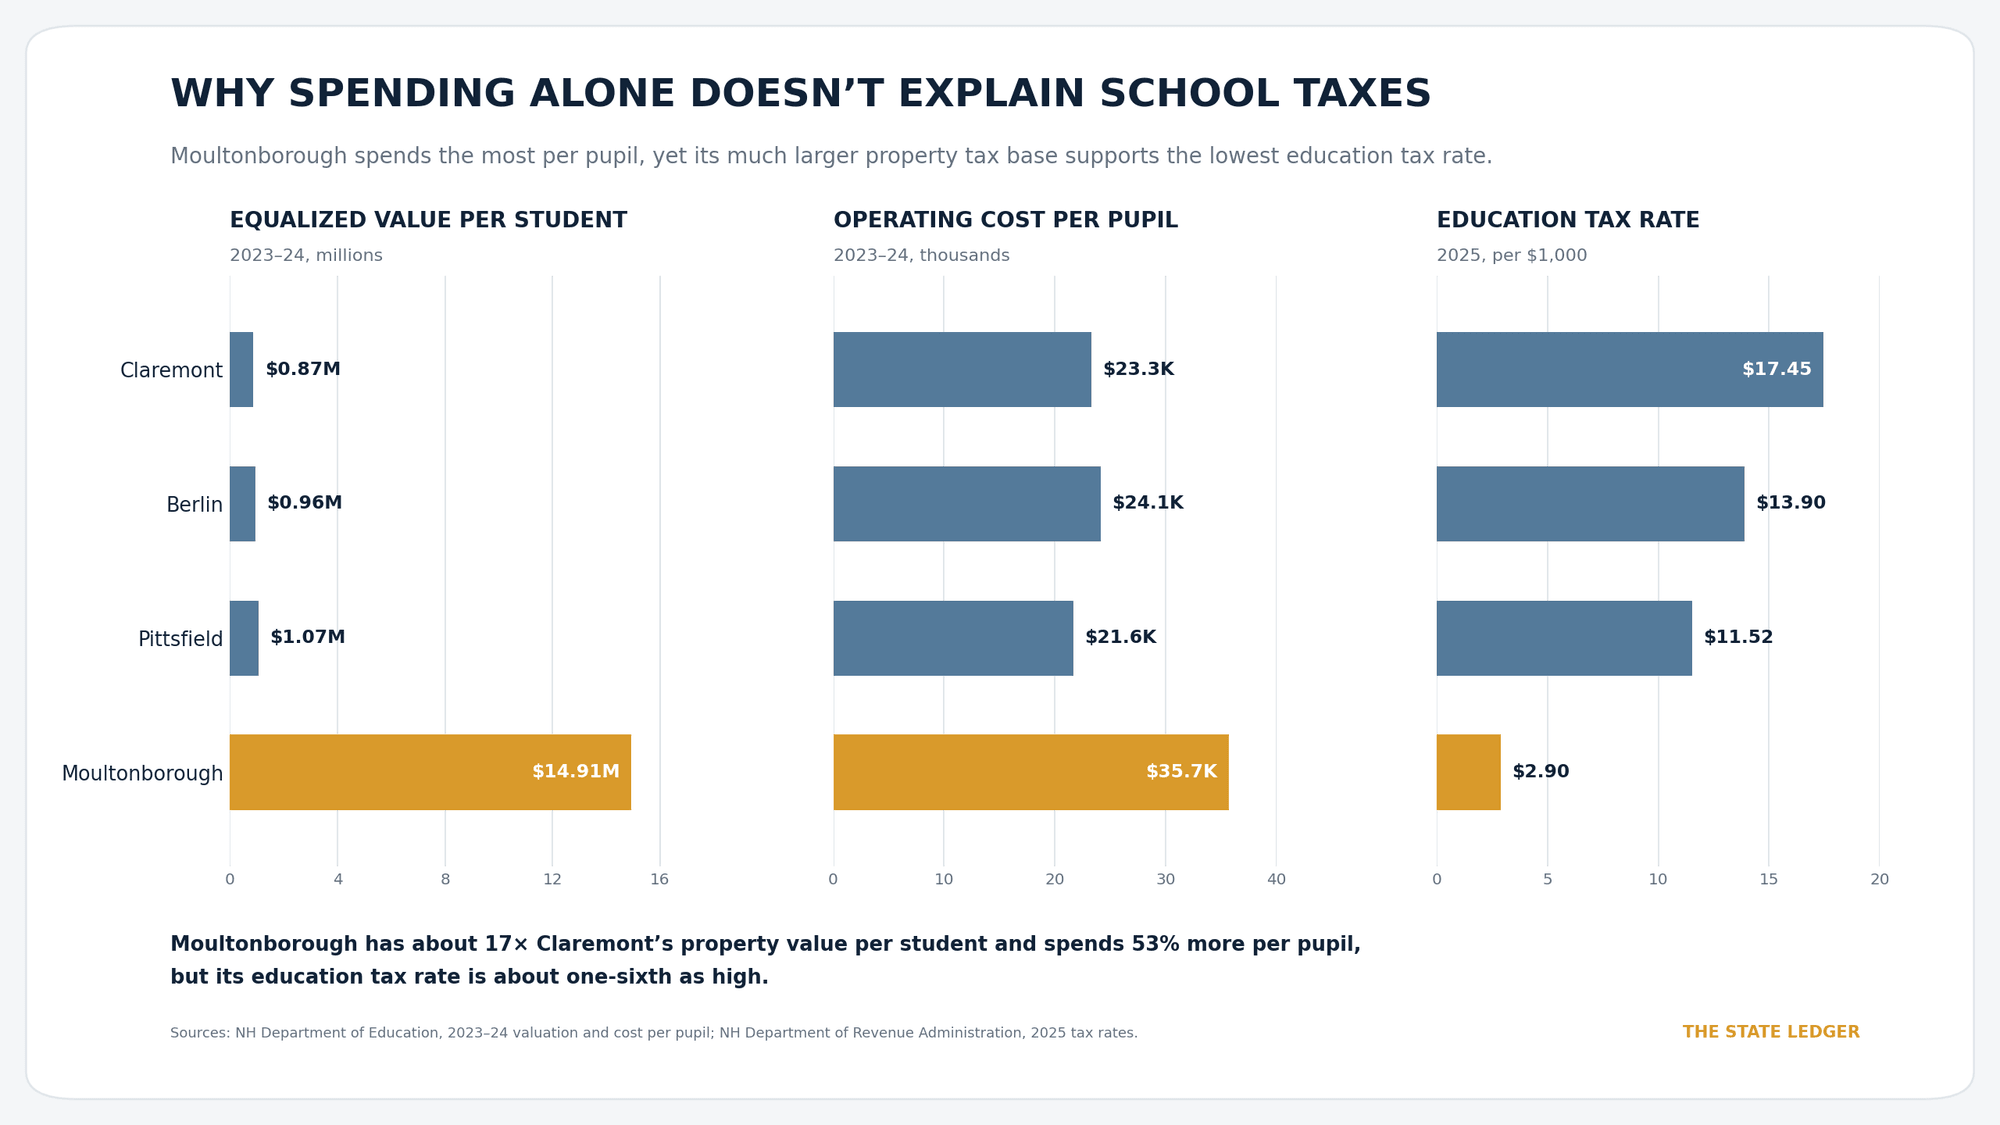
Moultonborough spends the most per pupil and has the lowest education tax rate of the four towns compared here.
Key finding
Moultonborough has about 17 times Claremont's property value per student and spends 53 percent more per pupil, but its education tax rate is about one-sixth as high.
 (opens the full-size image in a new tab)
The comparison
Three measures, four towns, one point each.
The first panel is the tax base: how much equalized property value stands behind each student. The second is what the district actually spends per pupil. The third is the education tax rate that results.
If spending drove tax rates, the three panels would broadly agree with each other. They do not. Moultonborough leads on spending and sits last on rate, because its tax base is more than an order of magnitude larger per student than Claremont’s.
What follows from it
The useful question this raises is not whether any of these towns spends too much. It is what a tax rate can be read as evidence of. Between two New Hampshire towns, a difference in education tax rate is at least as likely to reflect a difference in taxable property per student as a difference in budgeting.
What the evidence shows
- Equalized value per student for 2023-24: Claremont $0.87 million, Berlin $0.96 million, Pittsfield $1.07 million, Moultonborough $14.91 million.[1]
- Operating cost per pupil for 2023-24: Claremont $23,300, Berlin $24,100, Pittsfield $21,600, Moultonborough $35,700.[1]
- Education tax rate for 2025, per $1,000: Claremont $17.45, Berlin $13.90, Pittsfield $11.52, Moultonborough $2.90.[2]
- The town with the highest spending per pupil has the lowest education tax rate of the four.
What it does not show
- Four towns are not the state. This is an illustrative comparison, not a statewide distribution.
- It does not explain why the valuations differ, which involves second homes, lakefront property, commercial base and enrolment.
- The valuation and cost figures are 2023-24 while the tax rates are 2025, so the columns are not from a single year.
- It says nothing about educational results in any of the four districts.